After my previous post on this topic, I realised there were issues to address due to running Docker and cAdvisor on an ARM-based architecture.
The issue
As per my previous post, I use Raspberry Pi 4 devices. To get the cAdvisor container to run, you need to use the ARM64 image.
An inkling that something wasn’t quite right was the Grafana dashboard I was using showed no memory metrics:
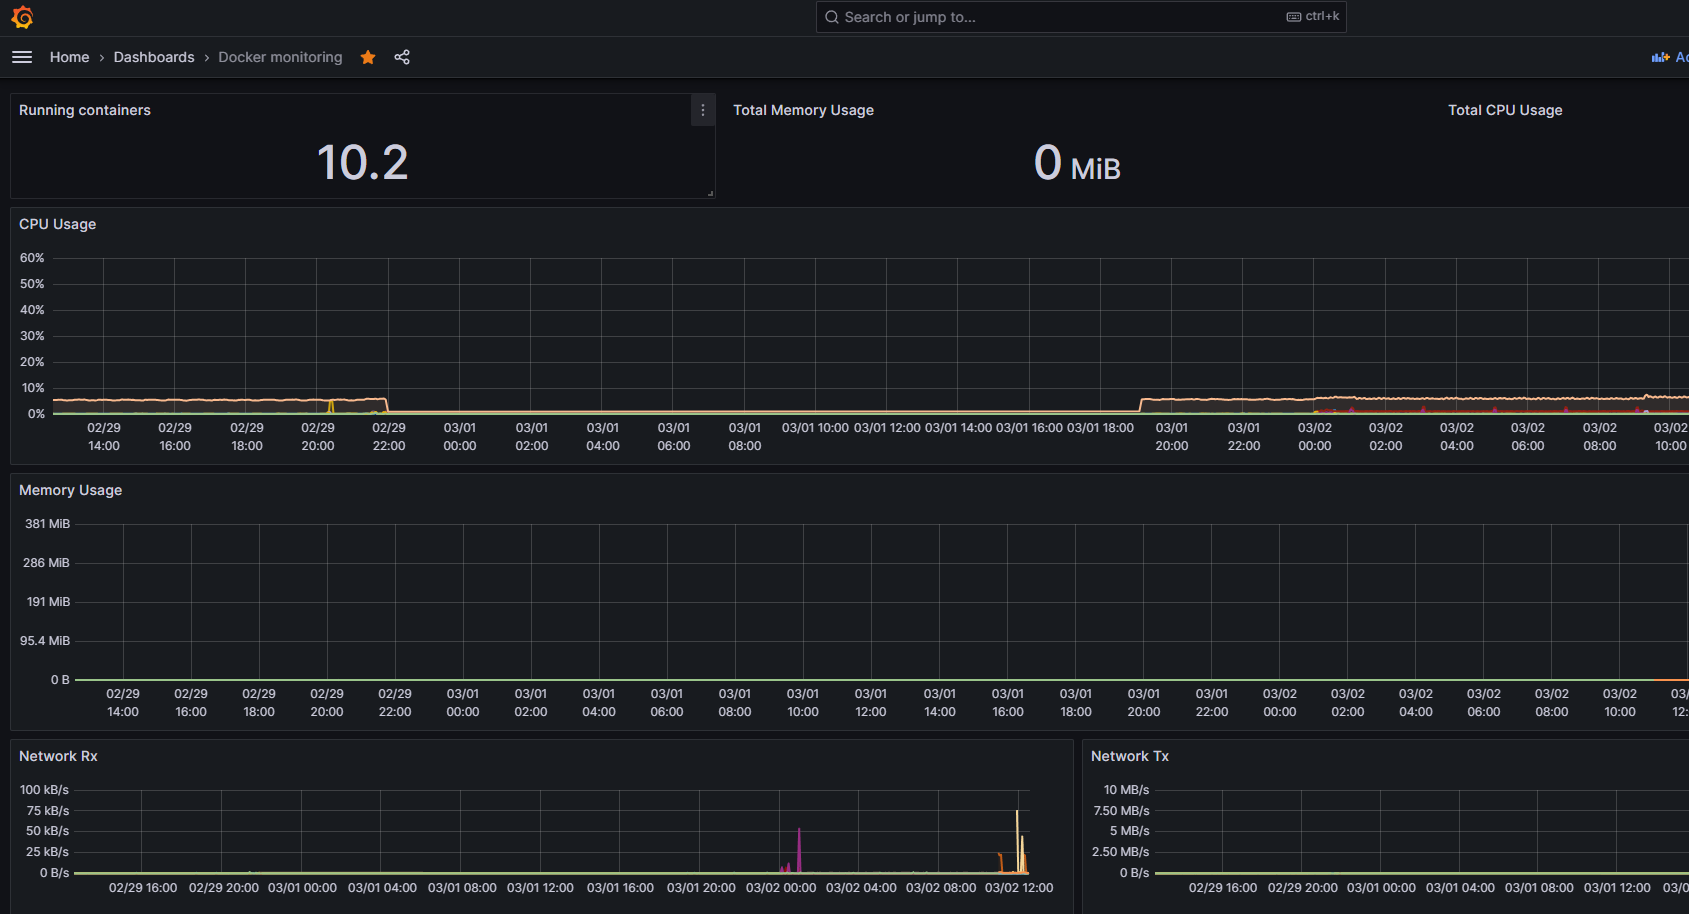
Note the Total Memory Usage of 0 MiB near the top and the memory usage graph flatlined at 0 also. CPU and Network metrics were being collected.
So, I figured I would check if Prometheus was the issue by running this query:
container_memory_usage_bytes{image!="",container_label_org_label_schema_group=""}And sure enough…

All of the containers showed 0, so no metrics were being scraped from cAdvisor.
This was confirmed by checking cAdvisor:

Next step of diagnosing this was also to look at the cAdvisor container logs:
W0302 12:25:27.492628 1 sysinfo.go:203] Nodes topology is not available, providing CPU topologyE0302 12:25:27.494534 1 info.go:119] Failed to get system UUID: open /etc/machine-id: no such file or directoryW0302 12:25:27.494693 1 machine.go:65] Cannot read vendor id correctly, set empty.W0302 12:30:27.496954 1 sysinfo.go:203] Nodes topology is not available, providing CPU topologyE0302 12:30:27.501845 1 info.go:119] Failed to get system UUID: open /etc/machine-id: no such file or directoryW0302 12:30:27.502435 1 machine.go:65] Cannot read vendor id correctly, set empty.W0302 12:35:27.490750 1 sysinfo.go:203] Nodes topology is not available, providing CPU topologyE0302 12:35:27.492545 1 info.go:119] Failed to get system UUID: open /etc/machine-id: no such file or directoryW0302 12:35:27.493171 1 machine.go:65] Cannot read vendor id correctly, set empty.W0302 12:40:27.496557 1 sysinfo.go:203] Nodes topology is not available, providing CPU topologyE0302 12:40:27.501353 1 info.go:119] Failed to get system UUID: open /etc/machine-id: no such file or directoryW0302 12:40:27.501863 1 machine.go:65] Cannot read vendor id correctly, set empty.W0302 12:45:27.499325 1 sysinfo.go:203] Nodes topology is not available, providing CPU topologyE0302 12:45:27.503918 1 info.go:119] Failed to get system UUID: open /etc/machine-id: no such file or directoryW0302 12:45:27.504530 1 machine.go:65] Cannot read vendor id correctly, set empty.So, there was clearly a number of things that need to be (re)configured to get things working.
Resolution
First off, I needed to change my docker-compose file:
version: '3'services: cadvisor: image: gcr.io/cadvisor/cadvisor-arm64:v0.47.2 hostname: cadvisor platform: linux/arm64/v8 privileged: true volumes: - "/:/rootfs:ro" - "/var/run:/var/run:ro" - "/sys:/sys:ro" - "/var/lib/docker/:/var/lib/docker:ro" - "/dev/disk/:/dev/disk:ro" - "/etc/machine-id:/etc/machine-id:ro" ports: - "18080:8080"Adding – “/etc/machine-id:/etc/machine-id:ro” fixes the “info.go:119] Failed to get system UUID: open /etc/machine-id: no such file or directory” issue.
Adding “privileged: true” removes the “1 manager.go:286] Could not configure a source for OOM detection, disabling OOM events: open /dev/kmsg: no such file or directory” issue.
Next up was the Pi boot file. Depending on the version of Raspberry Pi OS you are using, it is either /boot/cmdline.txt or /boot/firmware/cmdline.txt which needs some additions. Adjust the command below to the correct location of cmdline.txt:
sudo vi /boot/firmware/cmdline.txtI needed to add “cgroup_enable=cpuset cgroup_enable=memory cgroup_memory=1” to end of the line. My file looks like this:
console=serial0,115200 console=tty1 root=PARTUUID=76178ef8-02 rootfstype=ext4 fsck.repair=yes rootwait cgroup_enable=cpuset cgroup_enable=memory cgroup_memory=1Finally, the server needs a reboot:
sudo rebootFinal Checks
So lets check everything is fixed…
The cAdvisor docker log now only has this in it:
W0302 19:02:36.273124 1 sysinfo.go:203] Nodes topology is not available, providing CPU topologyW0302 19:02:36.284067 1 machine.go:65] Cannot read vendor id correctly, set empty.cAdvisor reports memory metrics:

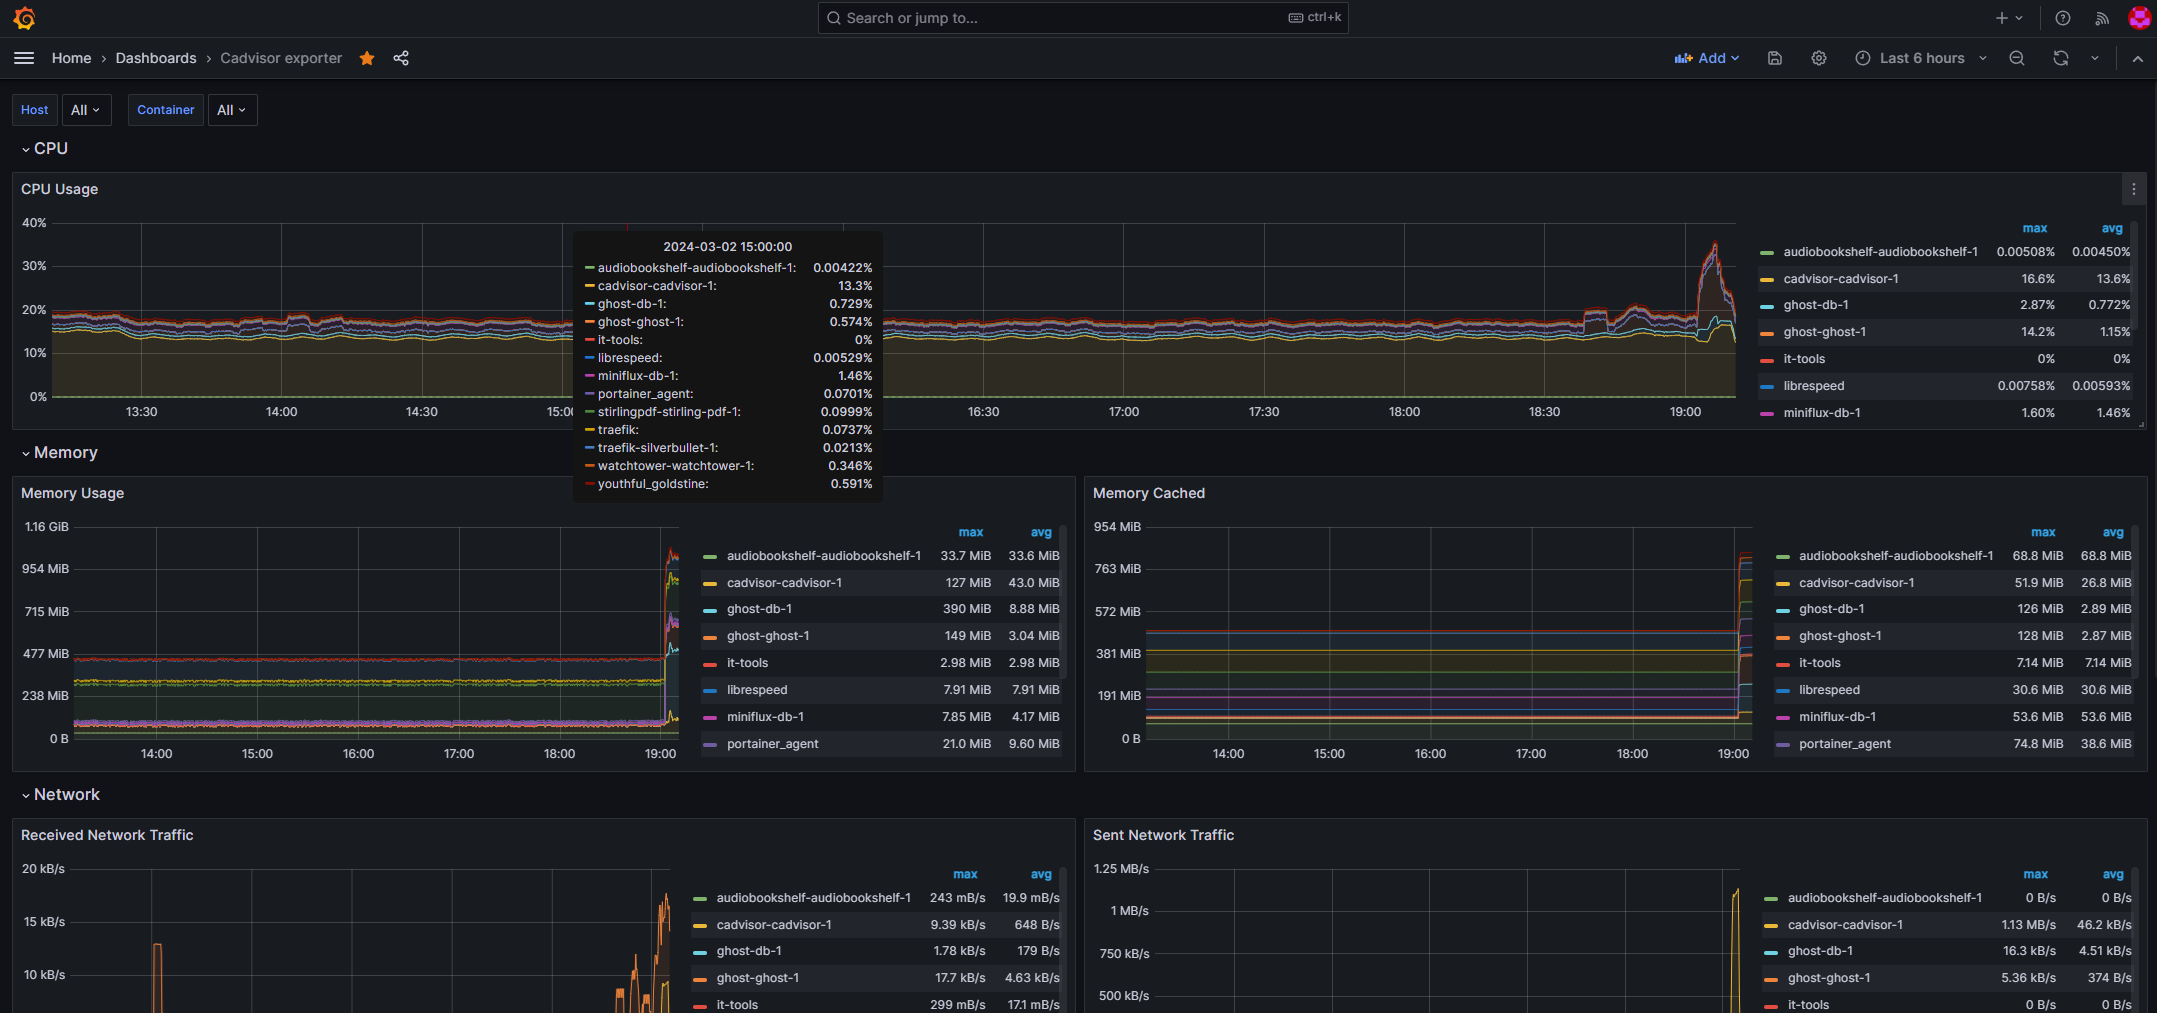
And the final check, the Grafana dashboard:

I also decided to change my default Grafana dashboard. I now use this one: https://grafana.com/grafana/dashboards/14282-cadvisor-exporter/

Leave a Reply