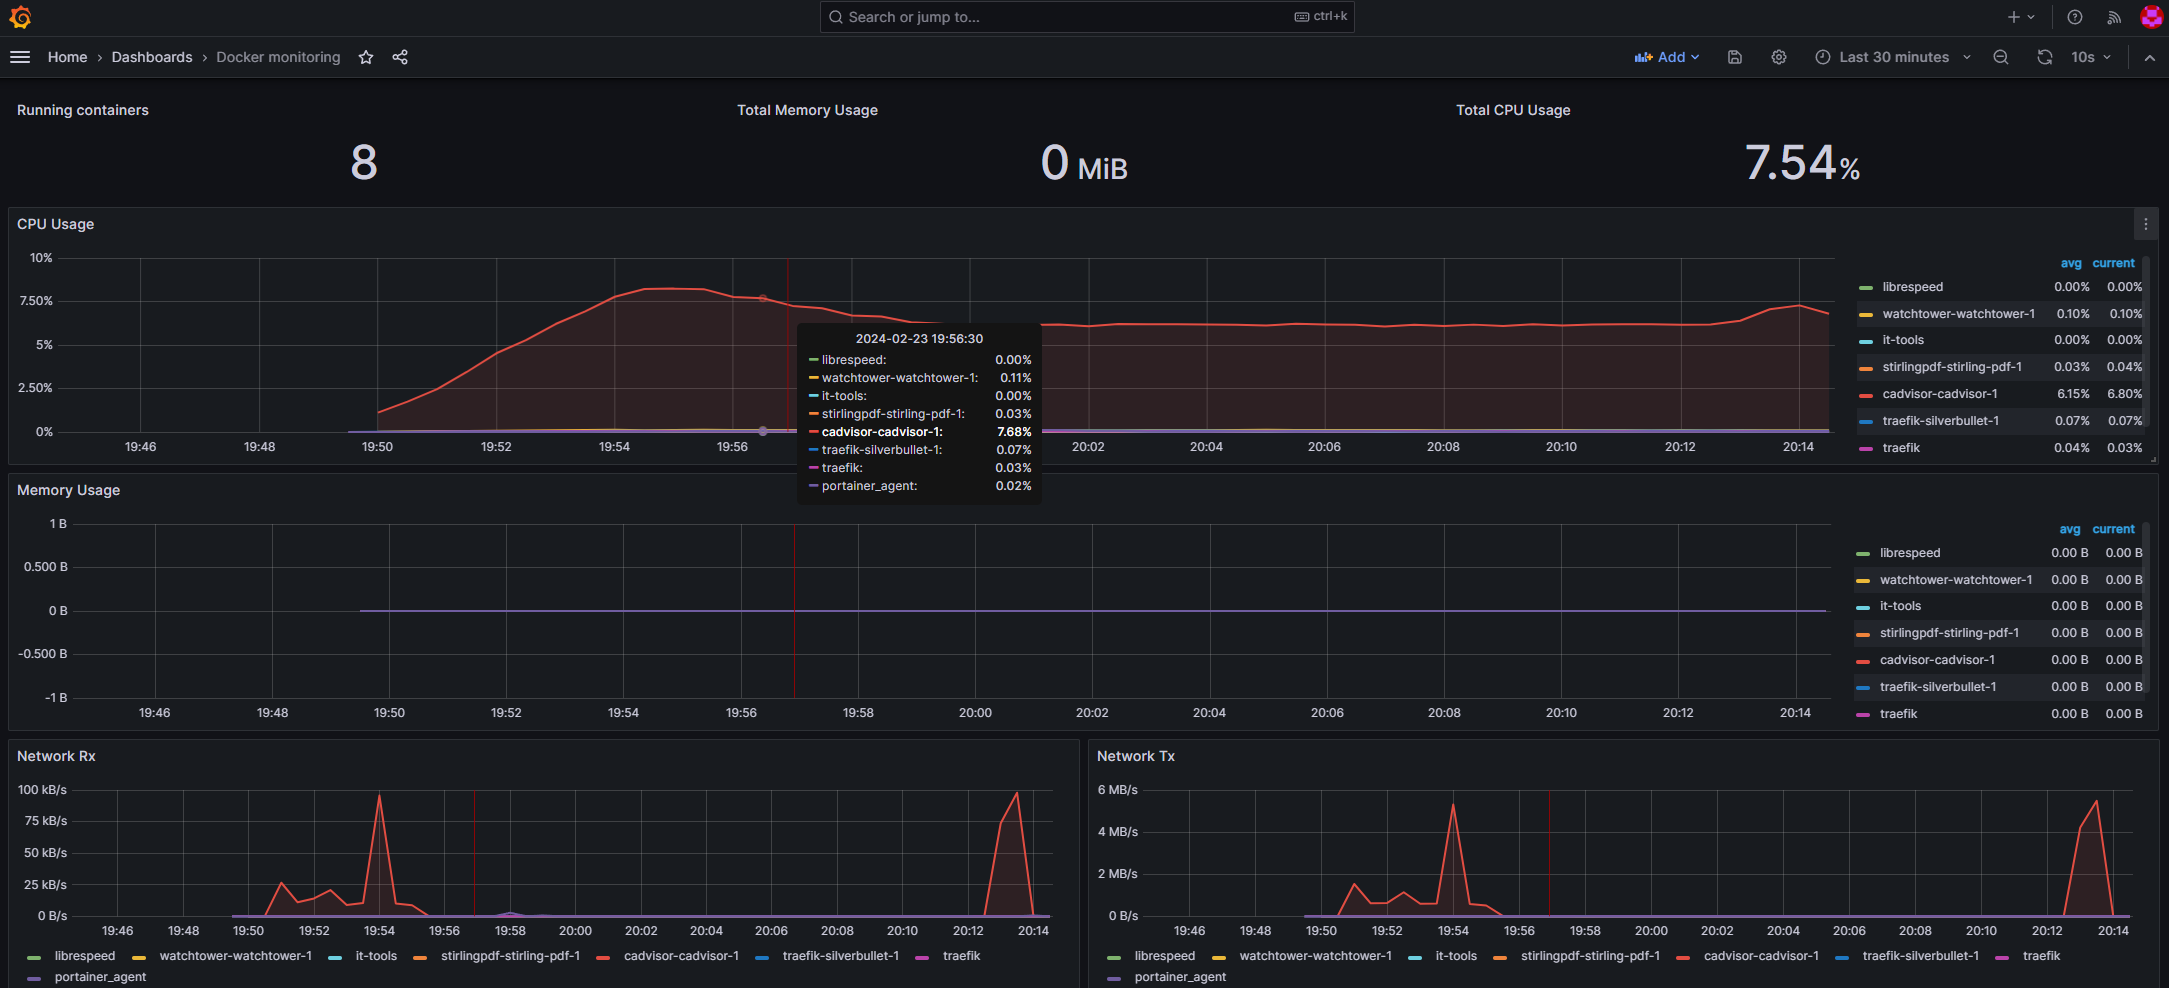
This article is a walkthrough of monitoring containers using cAdvisor, Prometheus and Grafana.
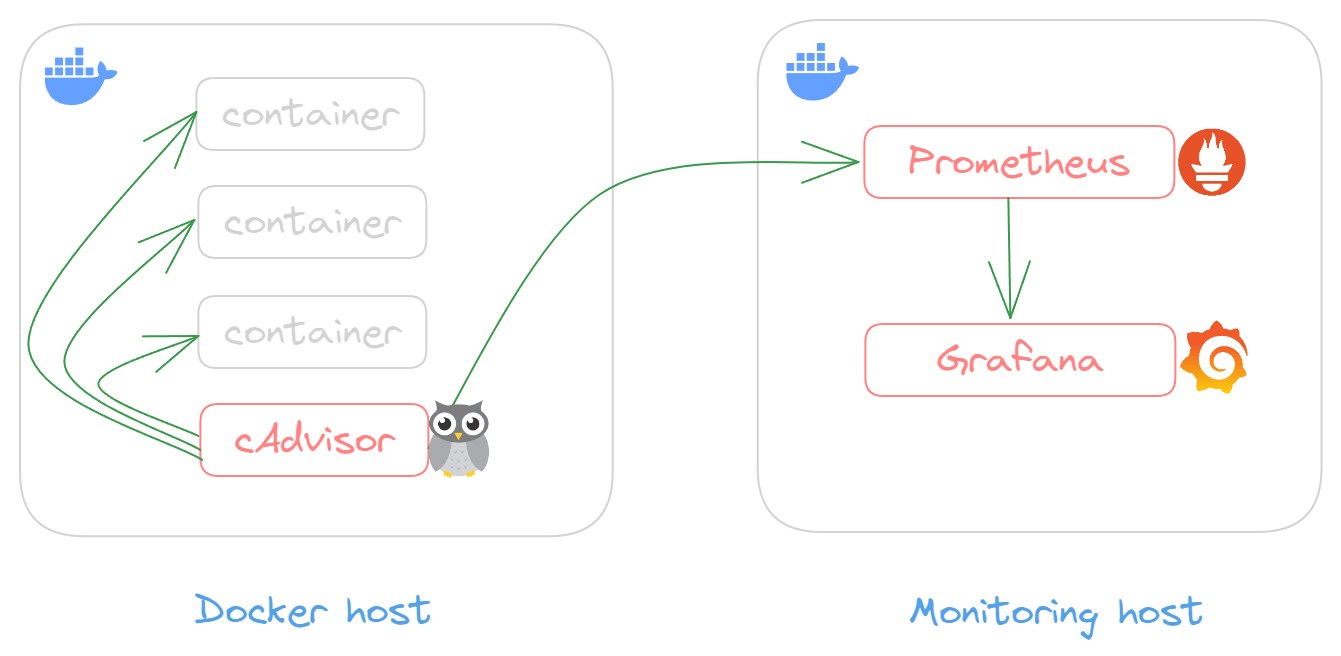
I run ‘lots’ of containers at home. At the moment, I have everything running across a number of hosts (predominantly Raspberry Pi 4 devices) running Docker. What I wanted to implement was a way to run cAdvisor locally in a container on each host and then feed that data in some way to a central location and then present that data in a user-friendly way. Step forward Prometheus and Grafana.
So the topology I wanted to implement is as follows:
cAdvisor
So lets start with the Docker host and installing cAdvisor.
This had me stuck for a while as all of the online resources I could find used the latest version of cAdvsior from the Google Registry : gcr.io/cadvisor/cadvisor:latest
When I included this as the container image in my docker compose file, I would get errors saying that the image differed from the underlying architecture as I am using a Raspberry Pi. I looked at the container registry and found there is actaully a native arm image. Annoyingly there is a missing manifest file in the registry, so I had to specify a specific version rather than the latest tag, before it would run.
My cAdvisor docker compose file has the following contents:
version: '3'services: cadvisor: image: gcr.io/cadvisor/cadvisor-arm64:v0.47.2 hostname: cadvisor platform: linux/arm64/v8 volumes: - "/:/rootfs:ro" - "/var/run:/var/run:ro" - "/sys:/sys:ro" - "/var/lib/docker/:/var/lib/docker:ro" - "/dev/disk/:/dev/disk:ro" ports: - "18080:8080"I’m mapping cAdvisor to listen on port 18080 as I already have something listening on 8080. Provided there isn’t any errors, you should be able to reach the GUI of cAdvisor by going to <hostname:port>, in my case <hostname:18080>
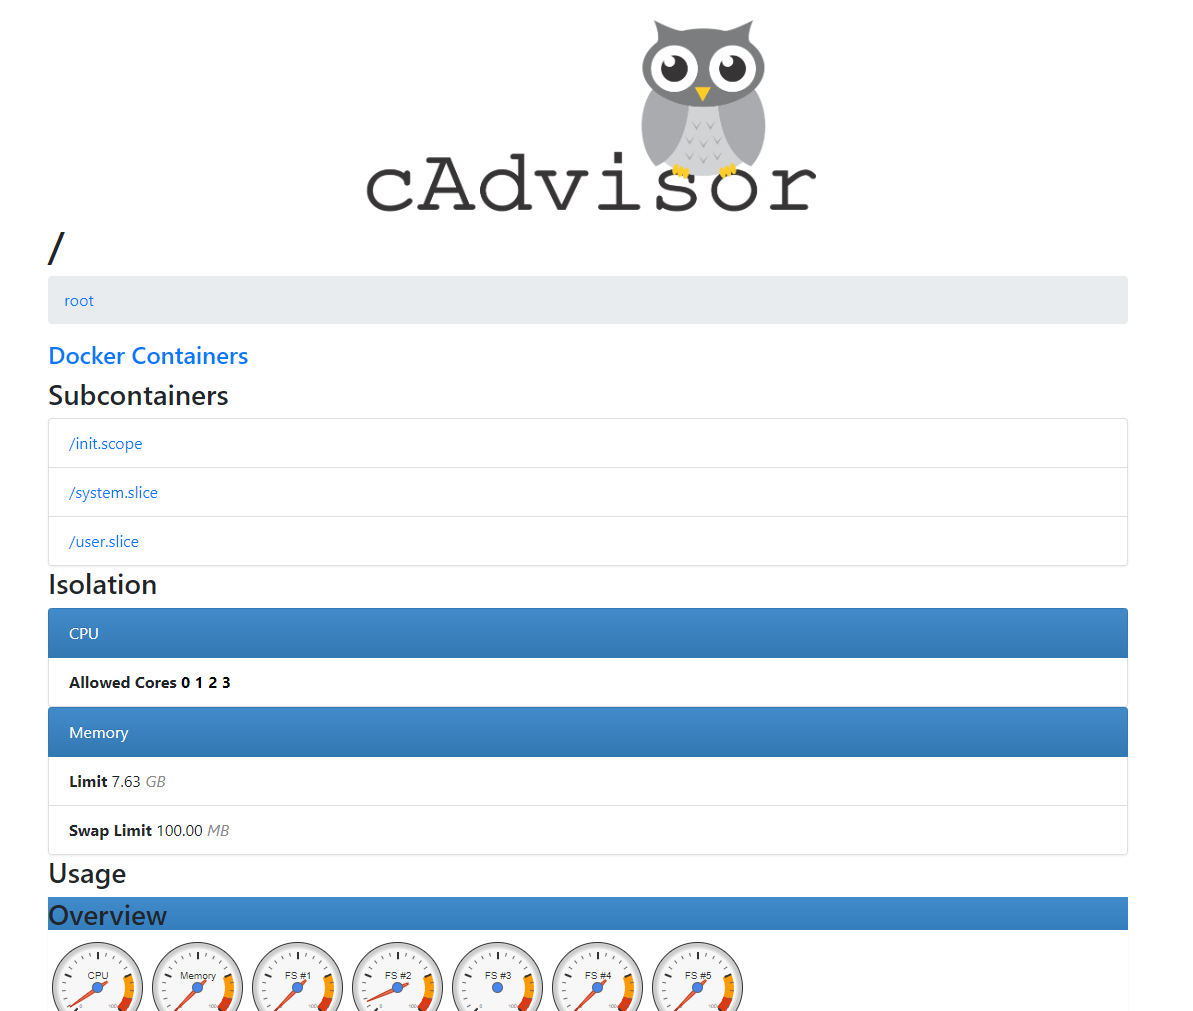
So far so good, now to get these metrics in to Prometheus. All of the guides I could find online are about running the cAdvisor-Prometheus-Grafana stack on the same host. I didn’t want to do this as I have multiple Docker hosts and want to centralise the metrics collection.
Prometheus
Next step was to install Prometheus on my ‘monitoring’ host. This server runs Docker. My docker compose file is as follows:
version: "3"services: prometheus: image: prom/prometheus:latest container_name: prometheus restart: unless-stopped volumes: - ./data/prometheus/config:/etc/prometheus/ - ./data/prometheus/data:/prometheus command: - '--config.file=/etc/prometheus/prometheus.yml' - '--storage.tsdb.path=/prometheus' - '--web.console.libraries=/etc/prometheus/console_libraries' - '--web.console.templates=/etc/prometheus/consoles' - '--web.enable-lifecycle' #- '--alertmanager.url=http://alertmanager:9093' ports: - 9090:9090This should be enough to bring up Prometheus however there is no configuration file for it so there will be errors in the log indicating so.
global: scrape_interval: 1mscrape_configs: - job_name: 'prometheus' scrape_interval: 1m static_configs: - targets: ['localhost:9090'] - job_name: 'cadvisor' scrape_interval: 10s metrics_path: '/metrics' static_configs: - targets: ['myhost:18080'] labels: group: 'cadvisor'In the above snippet, ‘myhost’ is the fully qualified domain of the Docker host that has cAdvisor on it. Restart Prometheus and it should now come up on whatever port you have mapped it to (in my case port 9090) – http://<monitoringhost>:9090
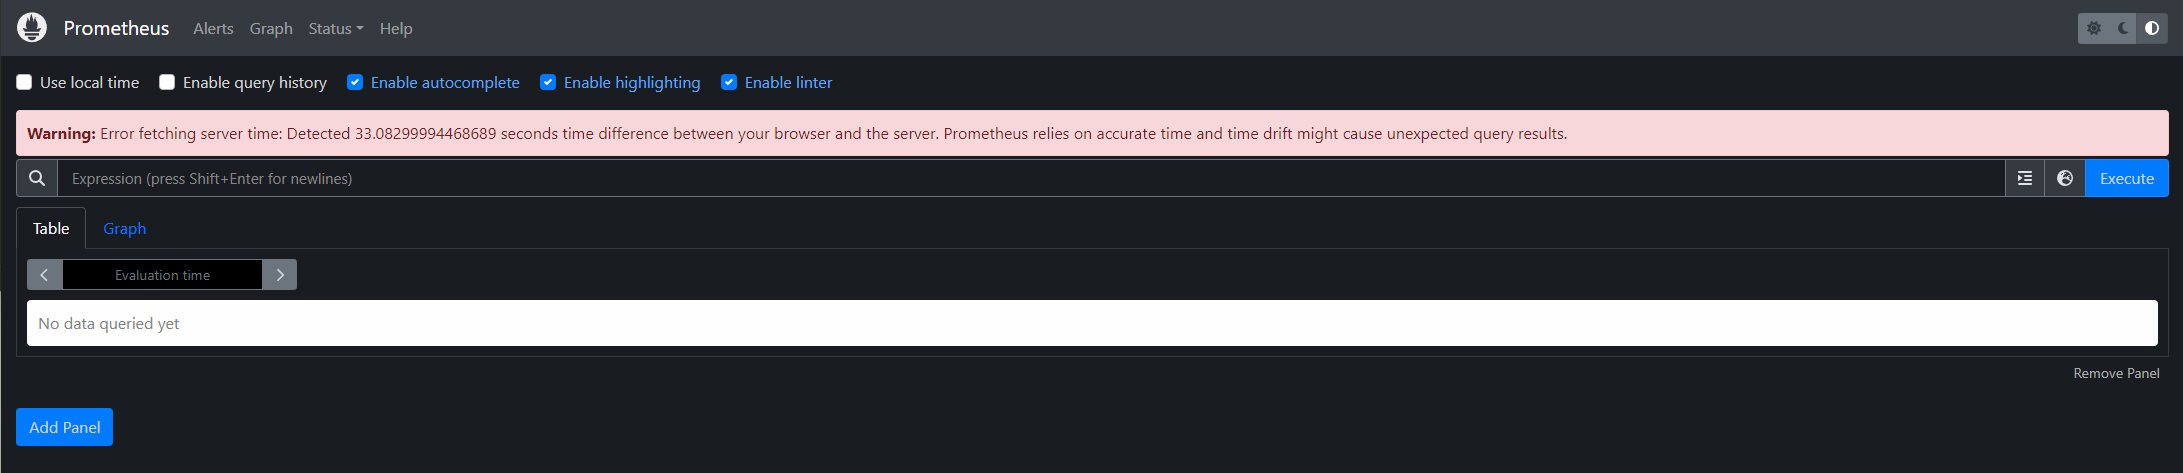
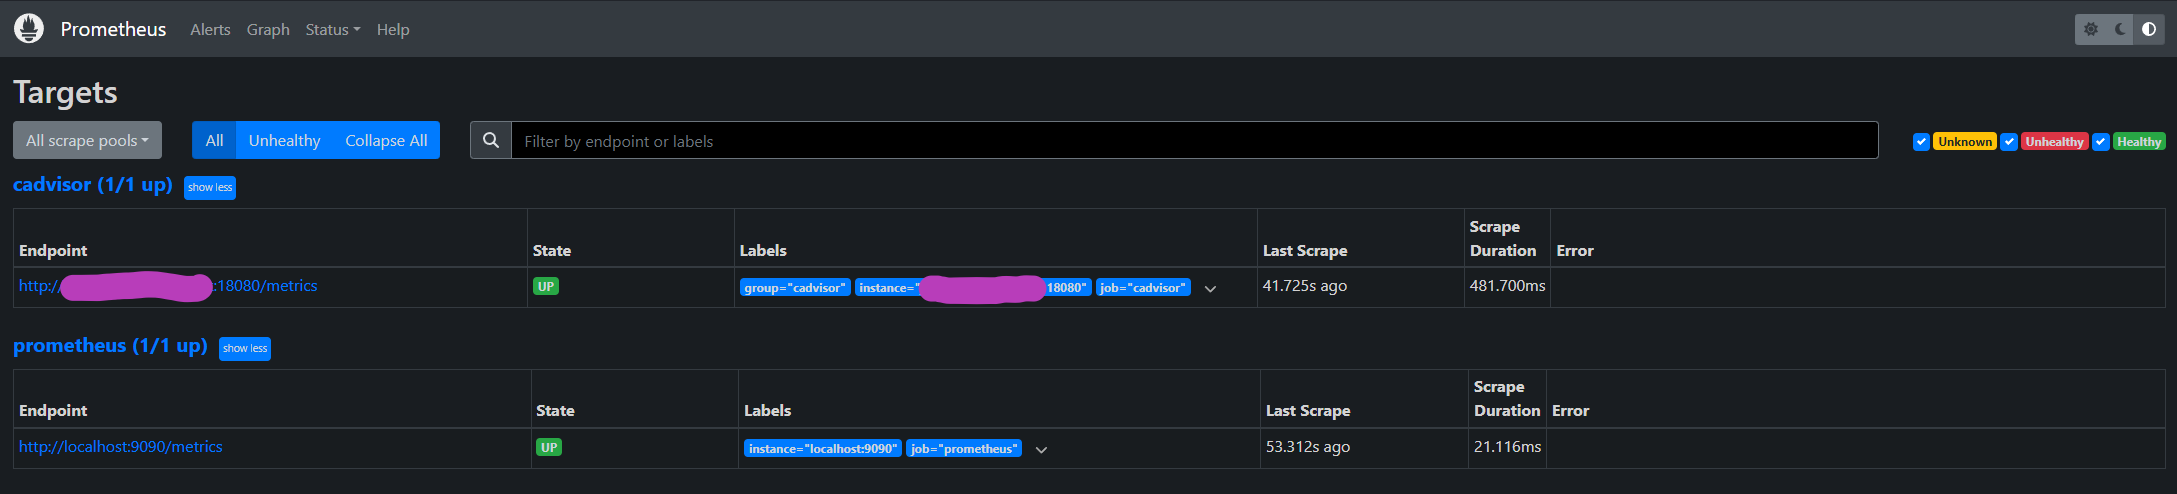
To check the metrics are being captured, click on Status and Targets in the top bar menu in Prometheus. You should see something along the lines of:
Almost there, just Grafana to go.
Grafana
I’m running Grafana on the same host as Prometheus, and my docker compose file for it is as follows:
version: "3.8"services: grafana: image: grafana/grafana-oss container_name: grafana restart: unless-stopped environment: - GF_SERVER_ROOT_URL=http://monitoringhost/ - GF_INSTALL_PLUGINS=grafana-clock-panel ports: - '3000:3000' volumes: - 'grafana_storage:/var/lib/grafana'volumes: grafana_storage: {}In the above snippet, ‘monitoringhost’ is the fully qualified domain of my monitoring host. This is only a basic config, but you can add alerting information via email etc. I’ll look to revisit this and share more detail on this in a later post.
If all has gone well, Grafana should come up on whatever port you have mapped it to (in my case port 3000) – http://<monitoringhost>:3000
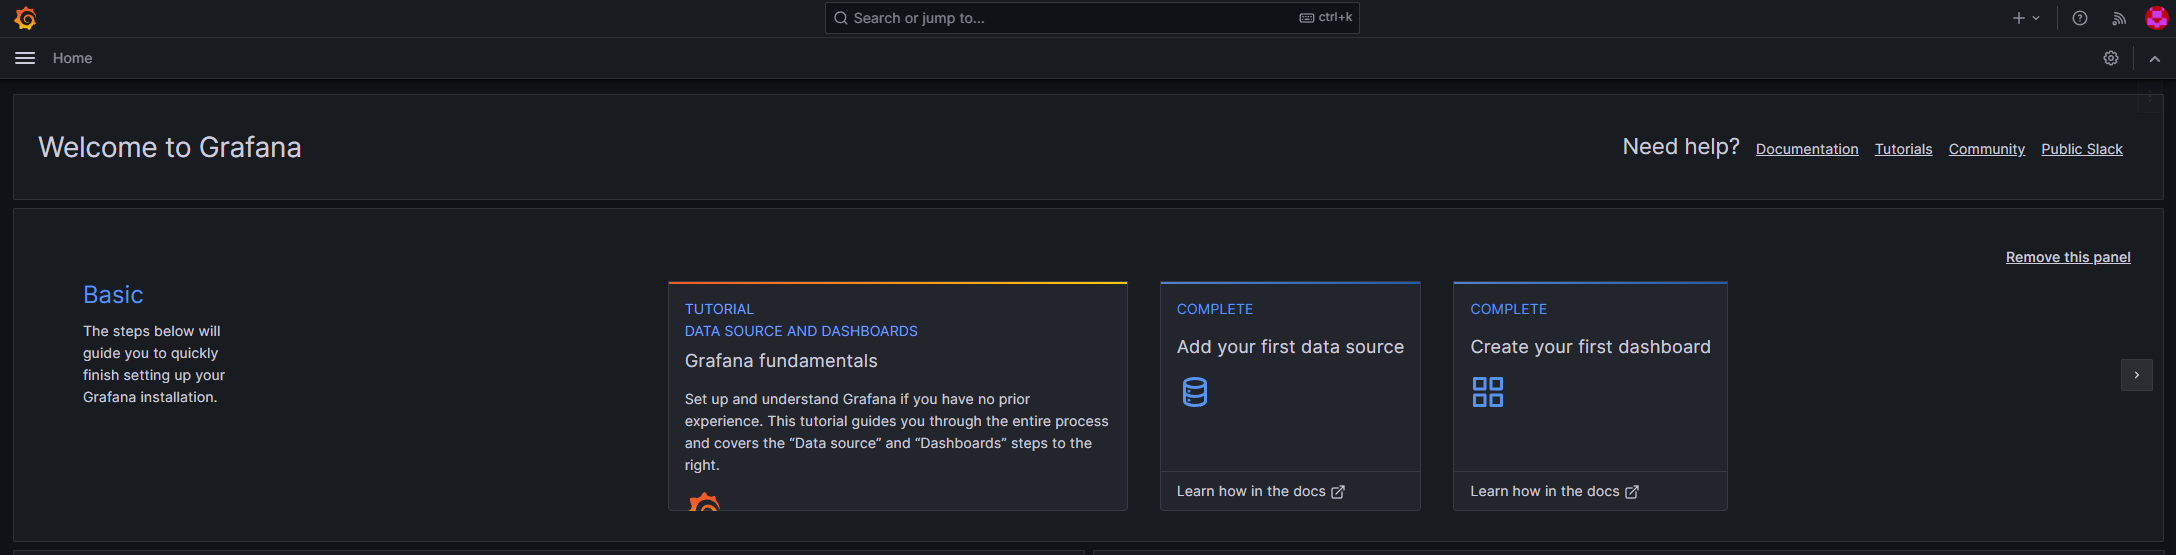
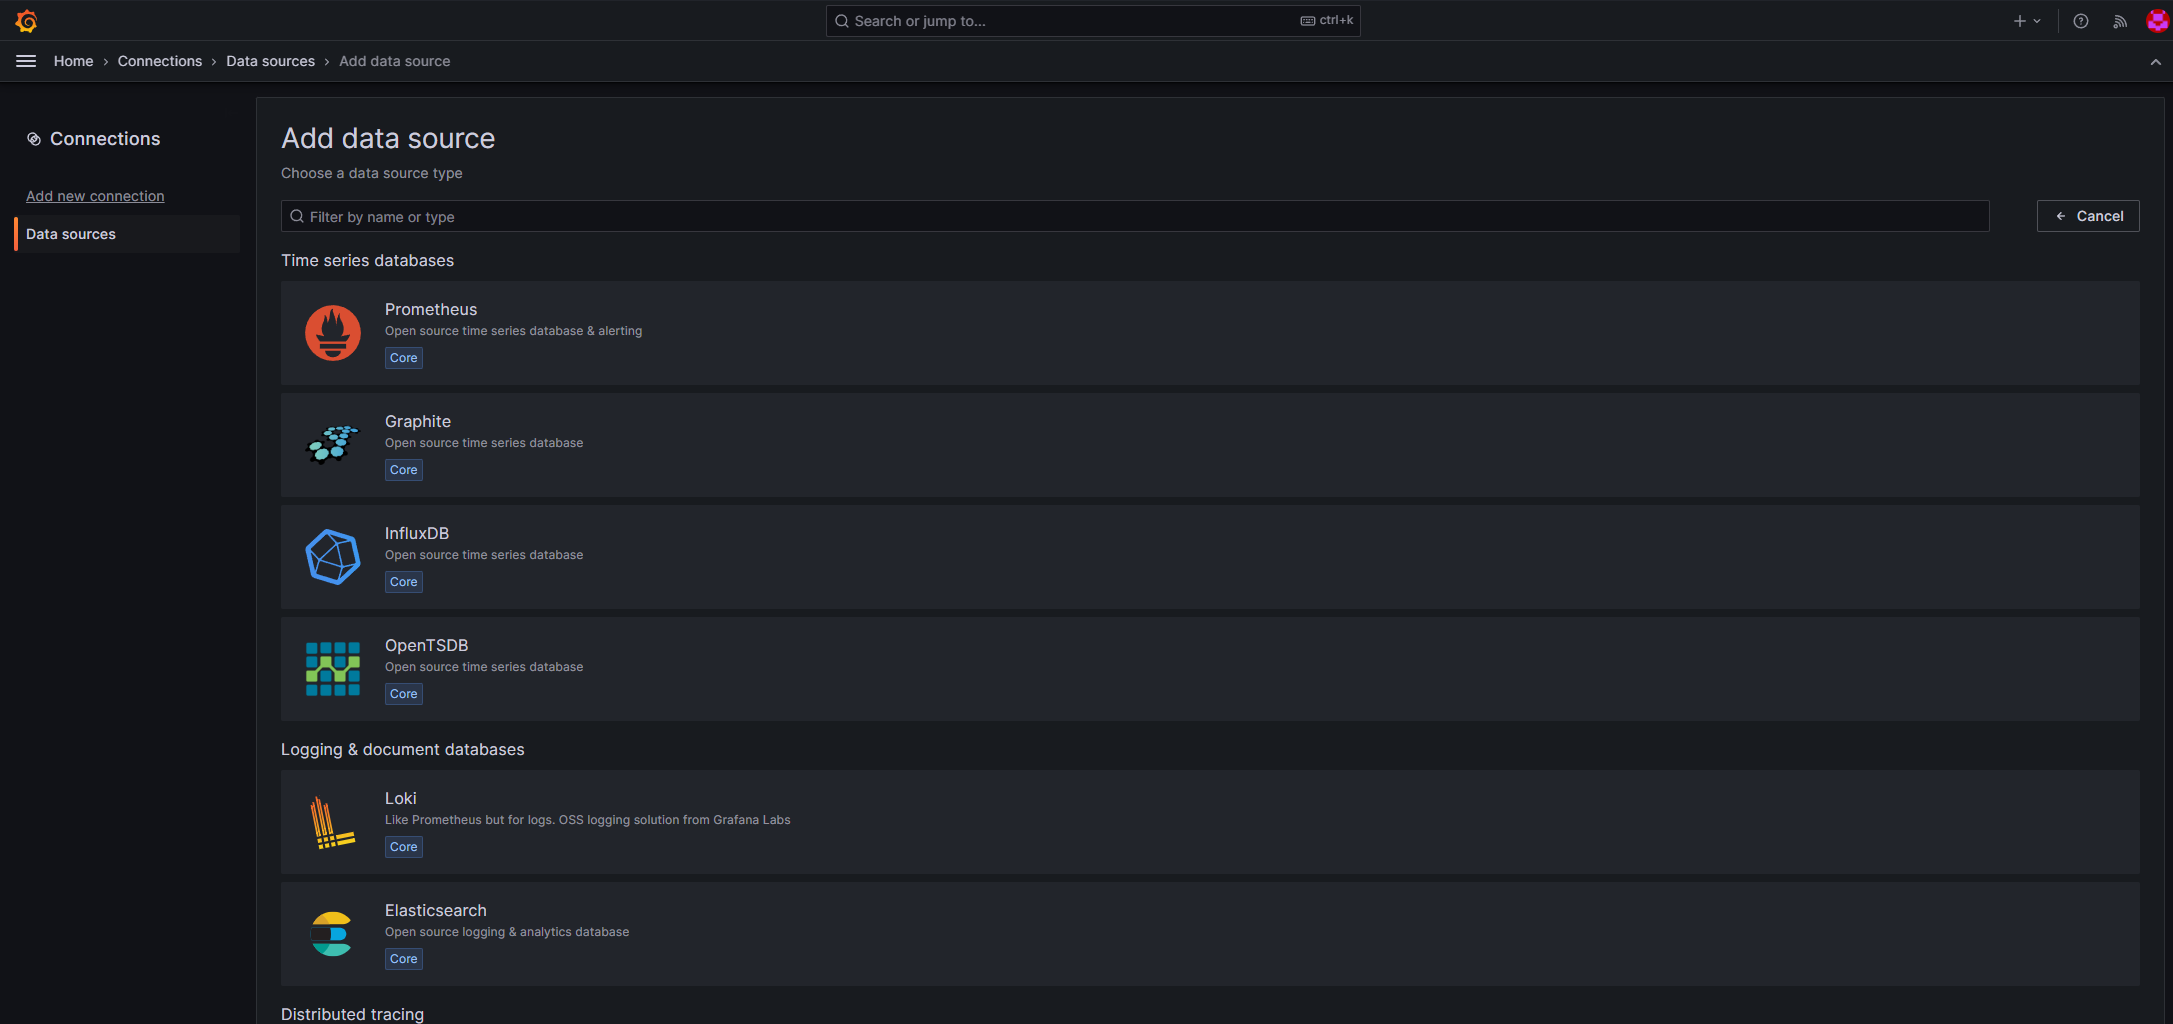
We need to do a couple of things before the data will be visible in Grafana. First off is creating a datasource. Navigate to http://<monitoringhost>:3000/connections/datasources/ and click on Prometheus (usually the first option):
Enter the fully qualified domain and port where you are running Prometheus:
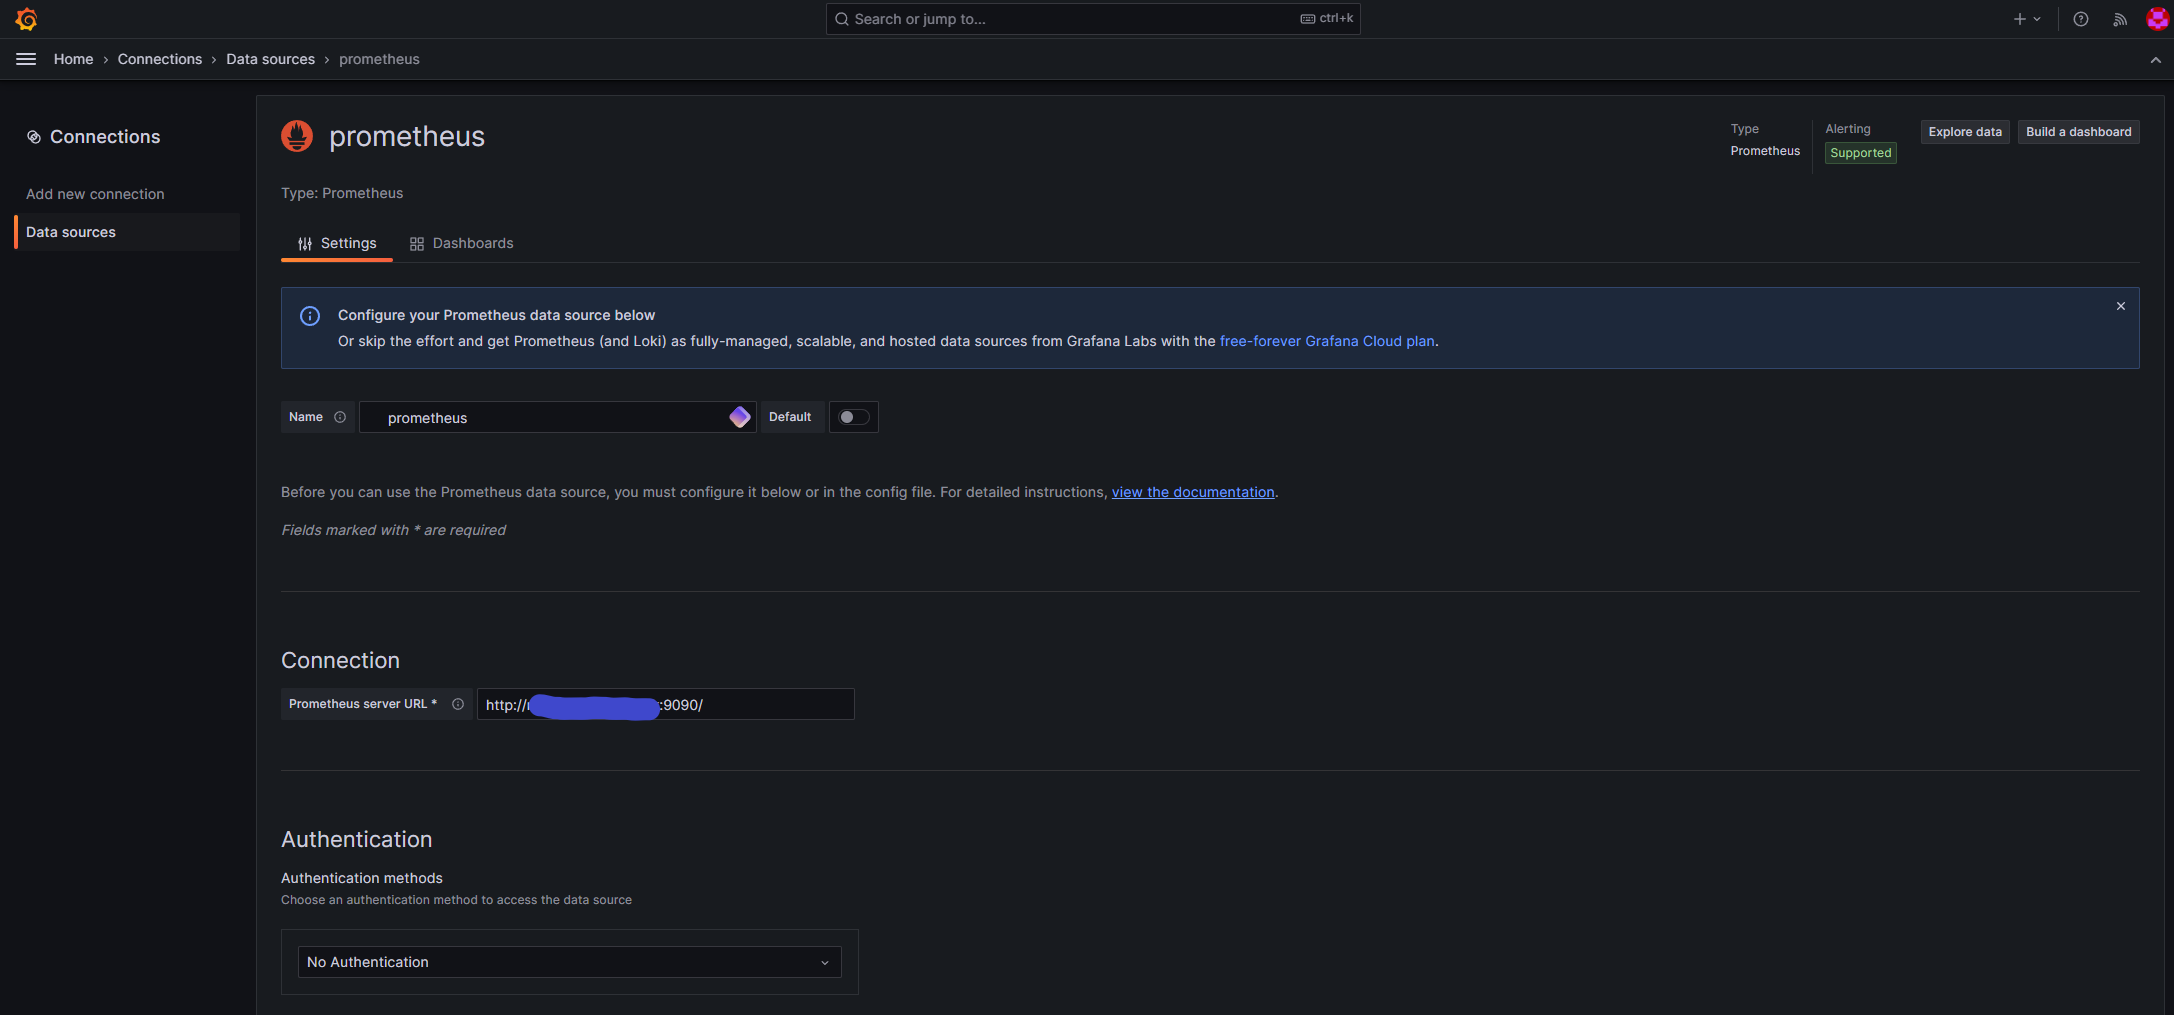
Click on ‘Save and Test’ at the bottom of the screen.
Finally, we now want to add a dashboard to display the metrics. I used the dashboard here: https://grafana.com/grafana/dashboards/193-docker-monitoring/ but there are lots out there. Click on Download JSON and save it. Navigate to http://<monitoringhost>:3000/dashboard/ and click on ‘Import Dashboard’. Upload the JSON file and you should then see metrics presented in a nice, readable fashion:
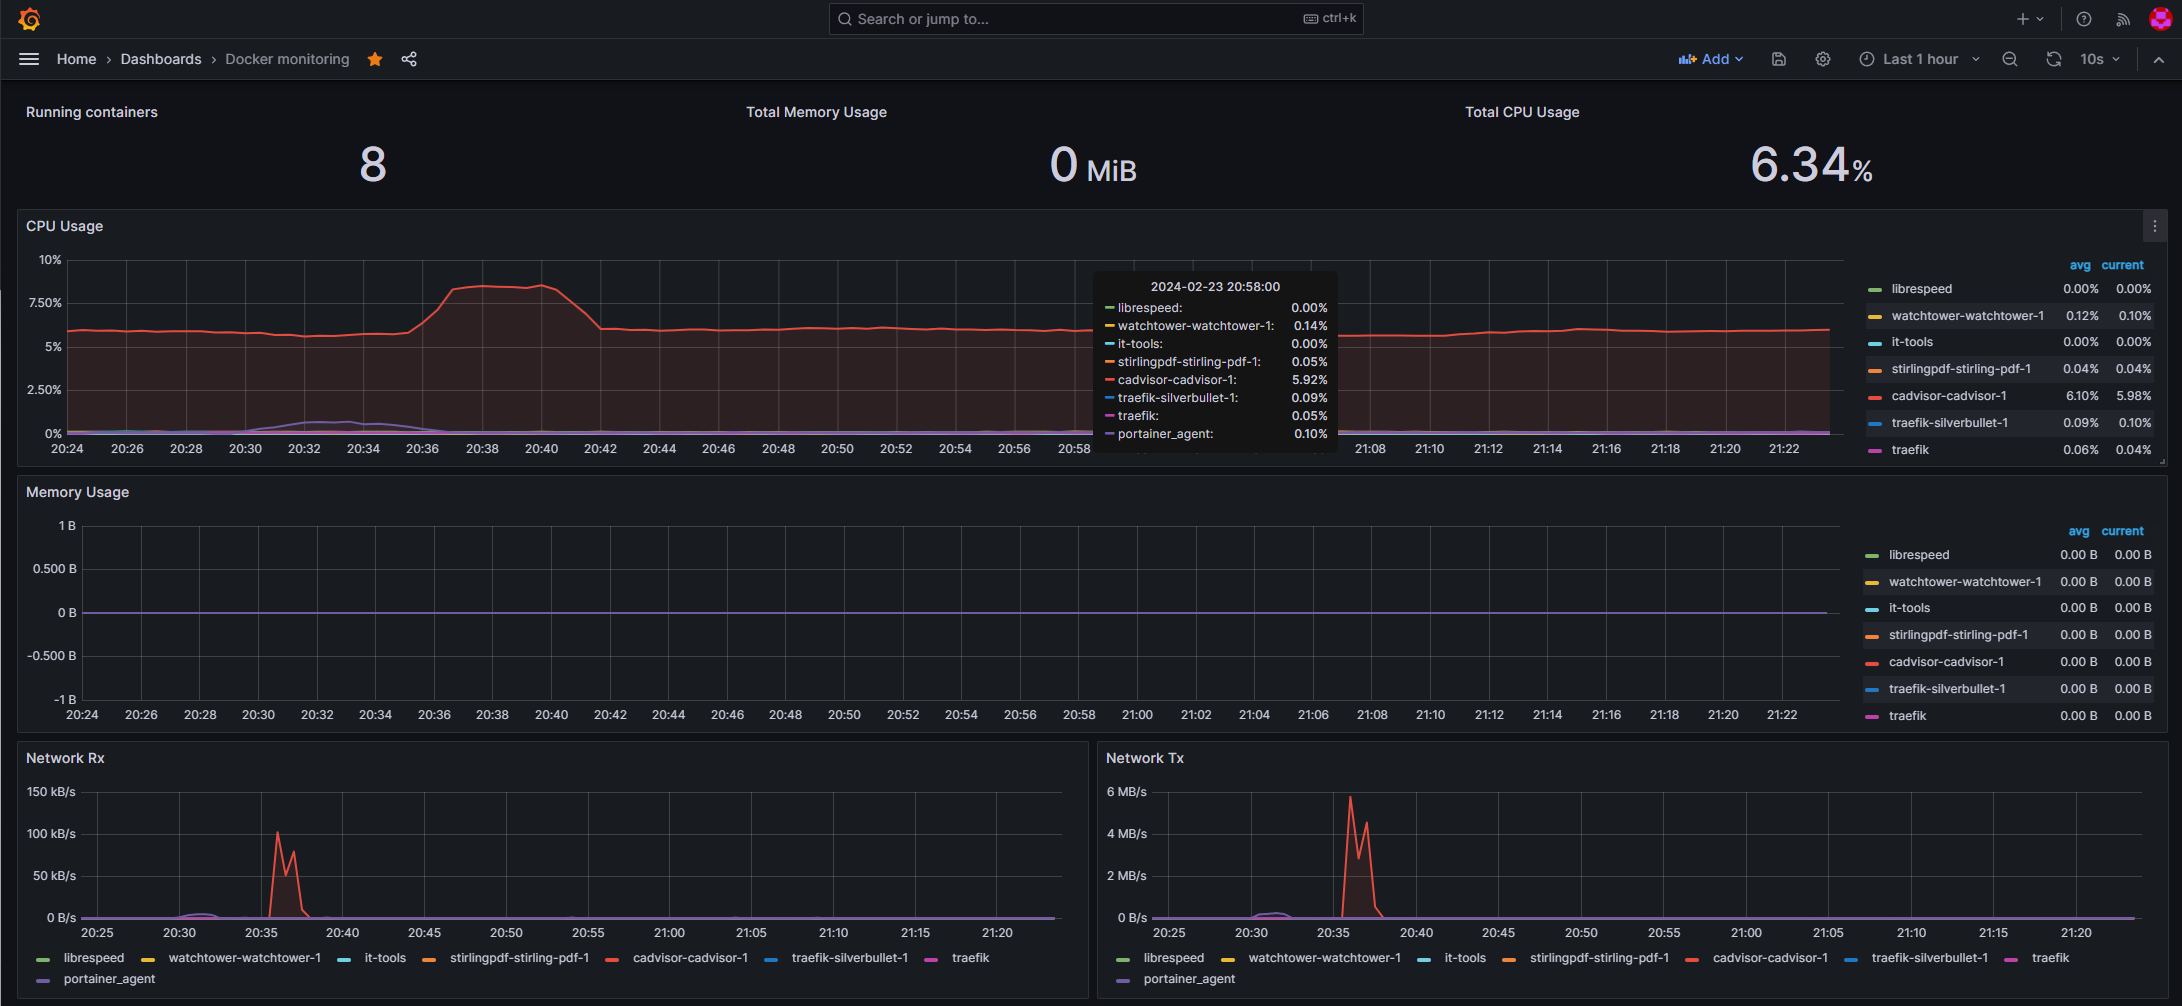
There you have it, a way to monitor your containers and present the information in meaningful way. This can be further augmented with alerting using Grafana, which I’ll look to cover in a later post if of interest.
Update
After posting this, there were a number of issues that needed to be fixed due to the ARM architecture. See here for Part 2 of this post.
 Darren Purvis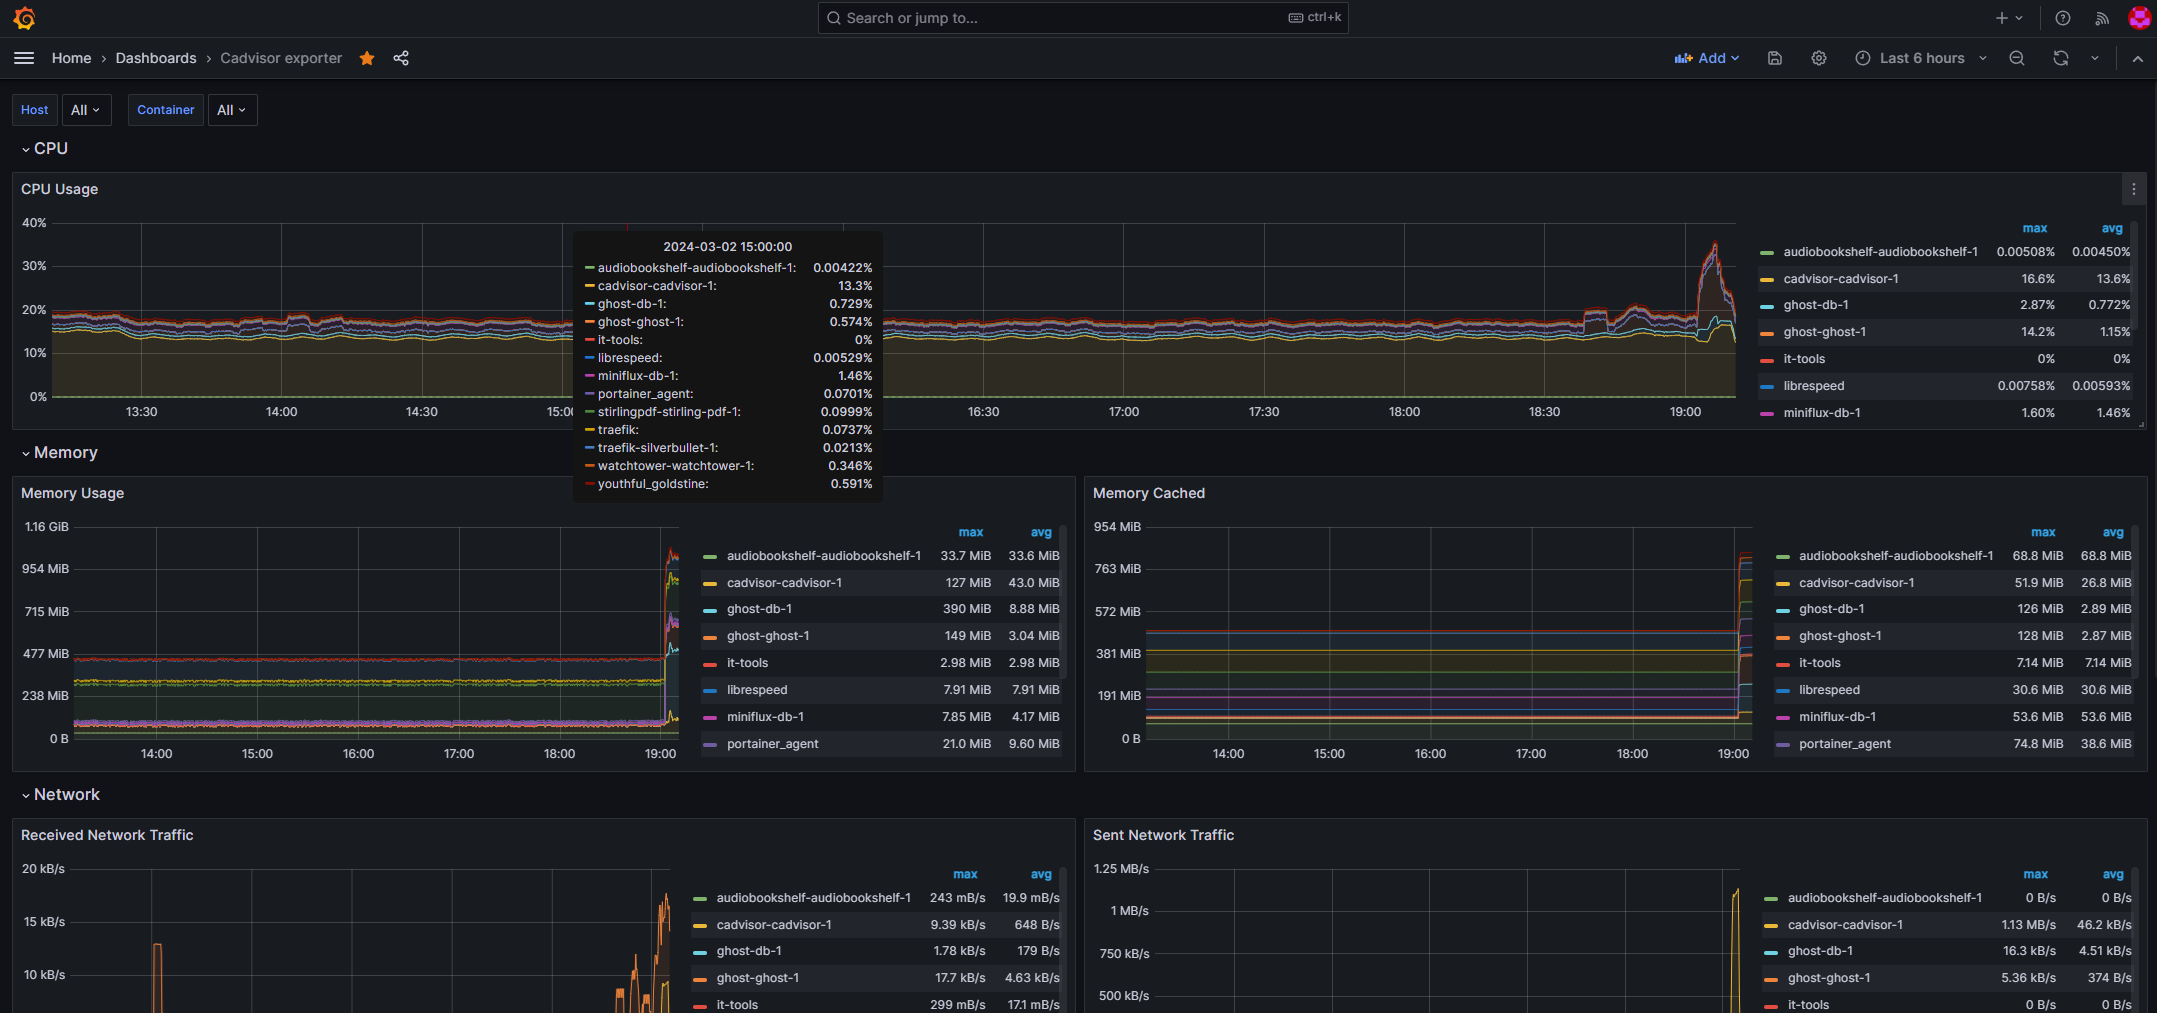
Leave a Reply